In a physics experiment where a parameter is being measured, the value of the parameter can not be correctly determined just from one observation. Therefore we need to take multiple numbers of observations and then take their average to determine the correct result. Basically, there are two types of errors that are possible in an experiment - one is due to a known defect in the instrument (such as zero error in a Vernier Caliper), and the other is due to the natural inability of an instrument to give correct result in a single observation due to various random effects. The first one is called systematic error and the second one is known as random error or statistical error. In this article, I shall discuss about random errors and a common mistake that we do during its evaluation. As I told you, multiple observations are necessary to determine the correct result, naturally a question comes - how to determine the sample size? The sample size depends upon mainly two factors - (1) the degree of accuracy expected and (2) the quality of the instrument that is making the observation. If you take a very large number of observations of a parameter x in an experiment, and then plot a graph between frequency (number of repeated results) and x, then the graph will be a Gaussian distribution -
Frequency, f = Constant × (1/√(2πσ2))exp(-(x-x̄)2/2σ2)
Fig.1 Gaussian distribution with average x̄= 10 and standard deviation σ= 2.1. Note that 99.73% of observations lie within x̄±3σ region.
The Gaussian distribution peaks at the average (x̄) and the span of the distribution tells the range in which individual observations can be obtained. Theoretically, this span is infinite on both sides, but about 99.73% of observations lie within ±3σ range (where σ denotes the Standard Deviation) of the distribution, and that may be very well considered to be our error limit in all practical cases. The thing which is most important here to note is that, in an experiment, if you take a very large number of observations (actually infinite, but that is not possible), then the average of these observations (x̄) may be considered to be a fairly accurate measurement of the parameter under study and therefore free from random errors. But, if we take only one observation, then the maximum possible difference between the observed value x and the accurate value x̄ can be ±3σ, and therefore that may be considered to be the maximum error possibility of a single observation. Let me give a practical example - suppose we want to measure the accuracy of the result given by a digital room-thermometer. Suppose on a given day, we take 1000 observations - which is fairly a large number of observations to give a Gaussian profile. So, the average of these 1000 observations (say 27oC) may be considered to be a fairly accurate value and random error, in this case, is negligible. Now we calculate the standard deviation from these 1000 observations, which comes out to be σ=0.4. Hence, the error limit or uncertainty of a single observation becomes ± (3×0.4)oC = ±1.2oC. So, in the future, we may not take multiple numbers of observations and then take their average to find out the accurate value, because that is impractical for a thermometer. Rather, we may limit ourselves by taking only one observation (x), saying that the maximum error possibility in the result is ±1.2oC which is still a good accuracy. For a good quality instrument, the standard deviation is expected to be small so that just a single observation is near to the accurate value. Although I am saying 'accurate value', it is never possible to find accurate value from experiments, because it needs infinite numbers of observations to be averaged, which makes no sense in the real world. As the sample size is increased, the average value comes closer to the accurate value. Once we choose a large sample size that gives an average sufficiently close to the real accurate value, we may consider this to be an approximate accurate value and hence find the uncertainty limit of a single observation as in the above example.

Fig.2 Average of the sample (y) has been plotted along the ordinate and its sample size along the abscissa. As we increase the sample size of observation, its average approaches the accurate value. The red line represents accurate value - means, the average of infinite number of observations and the pink shaded region indicates possible average values for a given sample size.
Now I shall discuss a common mistake that we do in physics experiments. It is a common practice that, in physics experiments, we take 30 or 50 observations of a parameter and report their average value to be the result of the experiment and their standard deviation multiplied by ±3 to be the maximum error limit. But that is quite a wrong approach. The uncertainty range calculated from the standard deviation of such a small sample size is not expected to include the accurate value and therefore this standard deviation is meaningless. The correct approach would be like this - suppose we consider the average of 50 observations to be one observation and let it be denoted by y (i.e. y=xi/50, where i goes from 1 to 50). So here 50 is our sample size and their average is our observation. Take a fairly large number of such observations (say 500) and then find the standard deviation from them. This new standard deviation (say σ') will be less than the standard deviation σ calculated from individual observations x (which was 0.4 in thermometer case) and is known as Standard Error. Therefore each of such y observation is a better representation of the accurate value than x. The ±3σ' limit will include the accurate value since total number of individual observations is quite large (i.e. 500×50=25000). As we increase the sample size of y (which is 50 considered above), the corresponding uncertainly limit ±3σ' is reduced, and each of such observation represents the accurate value better (see Fig.3). Once the uncertainty is determined for the instrument for a given sample size, we may take only one such y observation in future and report this with ±3σ' error limit. Note that, if we change the sample size, we need to find the uncertainty again for the new sample size. If the sample size is large enough so that σ is consistent and represents the standard deviation of the whole population upto a considerable accuracy, then we may estimate standard error σ' by σ/√N where N is the sample size.
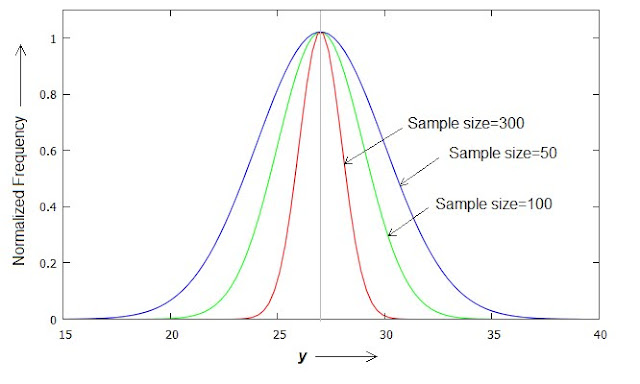
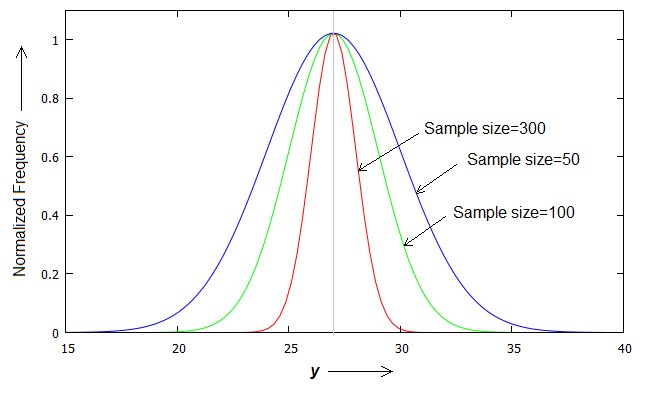
Fig.3 If we increase the sample size of each observation (e.g. 50,100 and 300 in the figure), then the standard deviation of their average (y) is reduced. Here the vertical line at the middle represents accurate value - which is the average of all y values in a given case. Hence an observation with large sample size is always closer to accurate value. The abscissa values of the maxima due to individual curves do not actually merge, but in this figure these have been plotted about the same point for ease of comparison only.
Summery: Next time when you go for a random experiment, the following points may be remembered -
(1) Average of a small sample size is closer to accurate value than a single observation. If the quality of your instrument is highest, then a small sample size can also fairly represent the accurate value.
(2) To calculate the associated uncertainty, the standard deviation within the sample is meaningless. First, one must take a large number of observations of a given sample size, then find the average of each of the samples separately, and then find standard deviation from these averaged values. This new standard deviation which is known as the standard error when multiplied by ±3 gives our error limit or uncertainty. This is just a one time operation.
If our sample size is large, we may also estimate standard error from only one sample by dividing the sample standard deviation by the square root of sample size.
(3) Once uncertainty is determined, one need not find it for future observations. Rather, in all future observations, only one sample of the above sample size can be taken, and its average may be reported as the result along with the uncertainty given by standard error.


Comments
Post a Comment